
How to A/B Test YouTube Thumbnails (The Complete 2026 Guide)
Learn how to A/B test YouTube thumbnails using YouTube's built-in Test and Compare tool and third-party alternatives. Step-by-step setup, what to test, how to read results, and common mistakes.
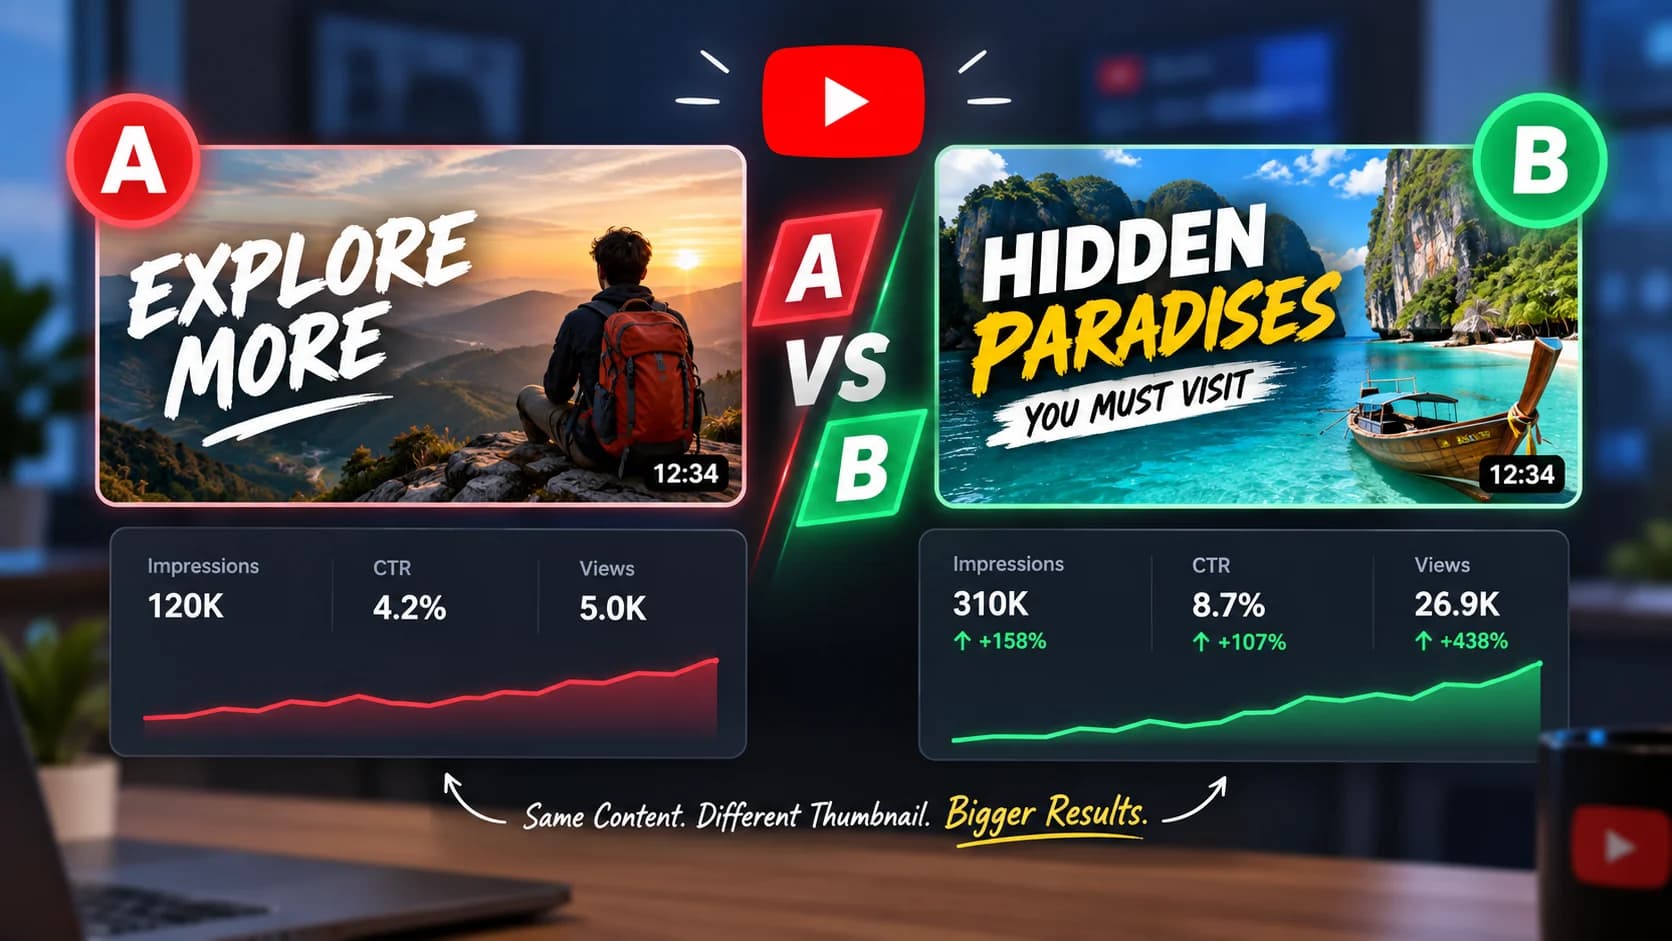
Your YouTube thumbnail is not a one-shot decision. The difference between a 3% click-through rate and a 7% click-through rate on the same video can mean double the views — and you will never know which thumbnail drives that difference unless you test.
TL;DR: A/B testing YouTube thumbnails means showing two or more thumbnail versions to different viewers and measuring which one earns more watch time. YouTube's built-in Test and Compare tool is the best way to do this in 2026 — it splits real traffic, measures watch time share (not just CTR), and declares a winner automatically. You can also use third-party tools like TubeBuddy for additional testing flexibility.
This guide walks you through every method available in 2026 for A/B testing your thumbnails: YouTube's native Test and Compare feature, third-party tools, and a manual method for channels that want full control. You will learn exactly what to test, how to read results, and how to avoid the mistakes that invalidate most thumbnail tests.
Key Takeaways
- YouTube's Test and Compare tool is the most reliable way to A/B test thumbnails — it uses watch time share, not just CTR, to pick winners.
- A winning thumbnail can increase a video's views by 20–30% or more without changing the content itself.
- You need at least 2,000–5,000 impressions per thumbnail variant before the results become statistically meaningful.
- Always test one variable at a time — changing the face expression, the text, AND the color scheme simultaneously tells you nothing about what actually worked.
- A/B testing works best on older evergreen videos that still receive consistent impressions, not just new uploads.
What Is YouTube Thumbnail A/B Testing?
A/B testing (also called split testing) is the process of showing two or more versions of a thumbnail to different segments of your audience and measuring which version performs better.
In a properly designed thumbnail A/B test, YouTube splits your video's impressions between Version A and Version B. Each group of viewers sees only one version. After enough data is collected, you compare the results and keep the winner.
The key distinction: a good A/B test measures watch time share, not just click-through rate. A thumbnail that gets more clicks but attracts the wrong audience (viewers who click and immediately leave) actually hurts your video. YouTube's algorithm cares about total watch time generated — and the best testing tools reflect this.
Why You Should A/B Test Your Thumbnails
Most creators upload one thumbnail and never revisit it. This is a missed opportunity for three reasons:
Your First Thumbnail Is Rarely Your Best
The thumbnail you create on upload day is based on a guess — an informed guess, but still a guess. You are predicting what will make thousands of strangers stop scrolling and click. Testing removes the guesswork and replaces it with measured audience behavior.
Small CTR Gains Compound Over Time
A thumbnail upgrade that increases CTR from 4% to 5.5% on a video getting 10,000 daily impressions means an extra 150 clicks per day. Over a year, that is approximately 55,000 additional views — from a single video, from a single thumbnail swap.
Old Videos Still Earn Impressions
YouTube continues to serve your older videos in search results, suggested feeds, and browse. A video published two years ago with outdated packaging competes against videos with 2026-era thumbnails in every suggested feed. Testing a new thumbnail on an old video gives it a second life without re-uploading or re-editing anything.
Method 1: YouTube's Built-In Test and Compare (Recommended)
YouTube's Test and Compare feature is the most reliable method for thumbnail A/B testing in 2026. It is built directly into YouTube Studio, uses real viewer data, and measures the metric that actually matters — watch time share.
What Is Watch Time Share?
Watch time share is the percentage of total watch time a thumbnail variant generates relative to the other variants. If Thumbnail A generates 55% of total watch time and Thumbnail B generates 45%, Thumbnail A wins. This metric is superior to raw CTR because it accounts for whether clicks lead to actual viewing.
How to Set Up a Test and Compare Experiment
Here is the step-by-step process:
Step 1: Open YouTube Studio
Go to studio.youtube.com and navigate to the Content tab in the left sidebar.
Step 2: Select Your Video
Click on the video you want to test. This works with both new uploads and existing published videos.
Step 3: Click "Test and Compare"
In the video details page, find the thumbnail section. You will see a "Test and Compare" option. Click it.
Step 4: Upload Your Thumbnail Variants
Upload up to three thumbnail options (including your current one). YouTube will automatically split impressions between all variants.
Step 5: Publish and Wait
Once you publish the test, YouTube begins splitting traffic immediately. You do not need to do anything else — the system runs automatically.
Step 6: Review Results
YouTube will declare a winner once it has collected enough data. You will see results in your YouTube Studio dashboard showing watch time share for each variant.
What the Results Mean
| Result | What It Means | What to Do |
|---|---|---|
| Winner declared | One thumbnail generated significantly more watch time share | YouTube automatically sets the winner as the active thumbnail |
| No winner | The variants performed too similarly to pick a clear winner | Both thumbnails are essentially equal — keep either one or test a more different variant |
| Not enough data | The video did not receive enough impressions during the test | Wait longer, or test on a higher-traffic video |
Requirements and Limitations
- Available to all YouTube channels (no minimum subscriber count required)
- You can test up to 3 thumbnail variants per test
- YouTube recommends waiting at least 2 weeks for results, though high-traffic videos may resolve faster
- You cannot run Test and Compare on YouTube Shorts — only standard long-form videos
- Only one test can run per video at a time
Method 2: Third-Party A/B Testing Tools
If you want more control, faster iteration, or features beyond what YouTube's native tool offers, third-party tools provide additional options.
TubeBuddy A/B Testing
TubeBuddy's A/B testing tool rotates thumbnail and title variants on your videos and measures real click-through rate changes.
| Feature | Details |
|---|---|
| How it works | Automatically swaps thumbnails on a schedule and compares CTR |
| What it measures | Click-through rate (CTR) from YouTube Analytics |
| Plan required | Legend plan (paid) |
| Best for | Creators who want to test titles alongside thumbnails |
How to set up a TubeBuddy A/B test:
- Install the TubeBuddy browser extension
- Open any video in YouTube Studio
- Click the TubeBuddy icon and select A/B Tests
- Upload your variant thumbnail(s) and optionally add title variants
- Set the test duration and start the test
- TubeBuddy rotates the variants and reports which one earned the higher CTR
Thumblytics (Done-For-You Testing)
Thumblytics is a managed service that handles the entire A/B testing process for you. They analyze your channel, design challenger thumbnails and titles, and run tests using YouTube's native Test and Compare tool.
| Feature | Details |
|---|---|
| How it works | Their team designs new thumbnail/title variants and runs tests on your behalf |
| What it measures | Watch time share (via YouTube's Test and Compare) |
| Pricing | Monthly subscription, per-test pricing |
| Best for | Monetized channels with 100K+ subscribers who want hands-off optimization |
| Guarantee | 100% money-back on tests where their variant loses |
Comparison: Native vs. Third-Party Testing
| Feature | YouTube Test and Compare | TubeBuddy | Thumblytics |
|---|---|---|---|
| Cost | Free | Paid (Legend plan) | Paid (per test) |
| Primary metric | Watch time share | CTR | Watch time share |
| Max variants | 3 | 2 | 2 |
| Setup effort | Self-serve | Self-serve | Done for you |
| Title testing | No | Yes | Yes |
| Shorts support | No | Limited | No |
| Best for | All creators | DIY creators who also test titles | High-traffic channels wanting expert optimization |
Method 3: Manual Thumbnail Testing (No Tools Required)
If you prefer not to use any tools, you can run a basic manual A/B test using YouTube Studio analytics alone. This method is less precise but still better than never testing.
How to Run a Manual Test
Step 1: Record Your Baseline
Before changing anything, write down your video's current performance over the last 7–14 days:
- Impressions
- Click-through rate (CTR)
- Average view duration
- Watch time
Find these in YouTube Studio → Analytics → Reach tab.
Step 2: Swap the Thumbnail
Upload your new thumbnail variant. Go to the video's details page in YouTube Studio, click the thumbnail area, and upload your new image.
Step 3: Wait 7–14 Days
Let the new thumbnail run for the same duration you measured in Step 1. Do not make any other changes to the video (title, description, tags) during this period — isolating the thumbnail as the only variable is critical.
Step 4: Compare the Numbers
Pull the same metrics for the test period and compare them to your baseline.
| Metric | Baseline (Week 1) | Test (Week 2) | Change |
|---|---|---|---|
| Impressions | 8,500 | 9,200 | +8.2% |
| CTR | 4.1% | 5.3% | +1.2 pts |
| Avg. View Duration | 6:42 | 6:38 | -0.1% |
| Watch Time (hours) | 38.2 | 44.7 | +17.0% |
Warning: External Variables
Manual testing is inherently noisy. Seasonal trends, algorithm shifts, a video going viral on social media, or even a competitor uploading a similar video can all skew your results. The more impressions your video gets, the more reliable the comparison. Manual testing works best on videos with at least 5,000 weekly impressions.
Why Manual Testing Is Less Reliable
The fundamental problem with manual testing is sequential bias: you are comparing two different time periods, not two simultaneous audiences. YouTube's Test and Compare solves this by splitting traffic at the same time — viewers in the same hour, the same day, with the same algorithmic context see different thumbnails.
Manual testing should be treated as directional evidence, not definitive proof. If you see a large, consistent improvement (CTR up 30%+), you can be reasonably confident. If the change is small (CTR up 5%), it could easily be noise.
What to Test: The 6 Highest-Impact Thumbnail Variables
Not all thumbnail changes are worth testing. Focus your tests on the variables that have the largest impact on click behavior.
1. Facial Expression
The expression on a face is the single most influential element in most thumbnails. Test drastically different emotions: shock vs. curiosity, intensity vs. calm, smile vs. serious.
2. Text vs. No Text
Some videos perform better with zero text on the thumbnail (letting the title do the work). Others need a bold 2–3 word text overlay. Test both.
3. Background Color
Color determines whether your thumbnail gets noticed in a sea of competing videos. Test complementary color schemes — blue/orange, yellow/purple — against your current palette. For detailed color strategies, see our 10 YouTube Thumbnail Formulas That Get Clicks.
4. Composition and Layout
Test the subject's position (left vs. center vs. right), the zoom level (tight crop vs. full body), and the number of visual elements (one subject vs. multiple).
5. Brightness and Contrast
A brighter, higher-contrast thumbnail stands out on mobile screens where most YouTube viewing happens. Test your current design against a version with increased brightness and saturation.
6. Object or Prop
Adding or removing a key object can dramatically change the story your thumbnail tells. Test with vs. without a product, a dollar amount, a result, or a before/after element.
The One-Variable Rule
Change only one element per test. If you change the face AND the text AND the color, you cannot determine which change caused the improvement (or decline). Professional A/B testers call this "isolating the variable." It takes patience, but it produces actionable insights.
How to Read Your A/B Test Results
Running the test is the easy part. Interpreting the results correctly is where most creators make mistakes.
Understanding Statistical Significance
A test result is statistically significant when the difference between variants is large enough that it is unlikely to be caused by random chance. YouTube's Test and Compare tool handles this calculation for you — it will not declare a winner until it reaches statistical confidence.
For manual tests and third-party tools, follow this rule of thumb:
| Total Impressions Per Variant | Minimum CTR Difference to Be Meaningful |
|---|---|
| 1,000 | 2.0+ percentage points |
| 5,000 | 1.0+ percentage points |
| 10,000 | 0.5+ percentage points |
| 50,000+ | 0.3+ percentage points |
The more impressions you have, the smaller the difference needs to be for the result to be trustworthy.
Watch Time vs. CTR: Which Metric Matters More?
| Metric | What It Tells You | Limitation |
|---|---|---|
| Click-Through Rate (CTR) | How compelling the thumbnail is at generating clicks | A misleading thumbnail can have high CTR but low watch time |
| Watch Time Share | How much total viewing the thumbnail generates | Requires more data to reach a conclusion |
| Average View Duration | Whether the thumbnail attracts the right audience | Can be affected by video content, not just the thumbnail |
The answer: watch time share is the better metric. A thumbnail that attracts 100 clicks where 80 viewers leave after 10 seconds is worse than a thumbnail that attracts 70 clicks where 60 viewers watch for 8 minutes. YouTube's algorithm rewards total watch time, so optimize for that.
A/B Testing Checklist: Before, During, and After
Before the Test
- Choose a video with consistent traffic (at least 1,000 impressions per week)
- Design a variant that changes one element from the current thumbnail
- Ensure both thumbnails meet YouTube's specs: 1280×720, 16:9, under 2 MB for mobile upload (see our YouTube Thumbnail Size guide)
- Test your variant at 120 pixels wide to confirm mobile readability
During the Test
- Do not change the video title, description, or tags during the test
- Do not share the video on social media differently than you normally would
- Wait for at least 2,000 impressions per variant (preferably 5,000+)
- Let YouTube's Test and Compare run for at least 2 weeks
After the Test
- Record the winning variant and the performance metrics
- Apply the winning insight to future thumbnail designs
- Plan the next test — A/B testing is an ongoing process, not a one-time event
- Download both variants for your records using a YouTube Thumbnail Downloader
5 Common A/B Testing Mistakes That Invalidate Results
Mistake 1: Testing Too Many Changes at Once
If your variant changes the face, the text, the color, and the layout all at once, a positive result tells you nothing about which change worked. Isolate one variable per test.
Mistake 2: Ending the Test Too Early
A test with only 500 impressions per variant is measuring noise, not signal. Let the test run until each variant has received at least 2,000 impressions — and preferably 5,000 or more.
Mistake 3: Ignoring Watch Time
A thumbnail with higher CTR but lower watch time is not a winner. The video that generates more total viewing minutes is the one YouTube will continue to promote.
Mistake 4: Only Testing New Uploads
New videos have volatile traffic patterns — a burst of subscriber notifications, then algorithmic discovery, then a potential plateau. This volatility makes A/B tests unreliable. The best candidates for testing are evergreen videos that receive steady impressions week after week.
Mistake 5: Never Testing Again After One Win
Your winning thumbnail today may not be the best thumbnail six months from now. Audience preferences shift, competitors evolve their packaging, and design trends change. The top creators run continuous A/B tests across their catalog.
Which Videos Should You A/B Test First?
Not every video on your channel is a good testing candidate. Prioritize these:
| Priority | Video Type | Why |
|---|---|---|
| 1st | Evergreen videos still getting 1,000+ weekly impressions | Steady traffic gives reliable results; improvements compound over months |
| 2nd | Your top 10 most-viewed videos | Even a small CTR improvement on high-traffic videos produces significant gains |
| 3rd | Videos where CTR is below your channel average | These have room for improvement — the packaging may be the bottleneck, not the content |
| 4th | Recent uploads (after the first 48 hours) | Wait for traffic to stabilize before starting a test |
To study what your top-performing thumbnails look like across your channel, download them using our Playlist Thumbnail Downloader and compare patterns across your highest-view videos.
FAQs
What is the best way to A/B test YouTube thumbnails?
YouTube's built-in Test and Compare tool is the best method. It splits real traffic simultaneously between thumbnail variants, measures watch time share instead of just CTR, and declares a statistically valid winner automatically. It is free and available to all channels.
How long should a YouTube thumbnail A/B test run?
Let the test run for at least 2 weeks, or until each variant has received at least 2,000–5,000 impressions. High-traffic videos may reach a conclusion in days, while lower-traffic videos may need 3–4 weeks. Do not end the test early — premature results are unreliable.
Can I A/B test thumbnails on YouTube Shorts?
No. YouTube's Test and Compare feature currently only supports standard long-form videos. For Shorts, you would need to use a manual testing approach: swap the thumbnail, wait, and compare analytics between the two time periods.
Does changing a thumbnail hurt YouTube algorithm performance?
No. Swapping a thumbnail does not reset a video's algorithmic performance or remove it from recommendations. YouTube treats a thumbnail change as a cosmetic update. However, if your new thumbnail attracts the wrong audience and watch time drops, the algorithm will respond to that behavior change over time.
How many thumbnail variants should I test at once?
Test 2–3 variants maximum. YouTube's Test and Compare supports up to 3 options. Testing more than 3 splits your impressions too thinly, making it harder to reach a statistically significant result. For most creators, testing 2 variants (your current thumbnail vs. one challenger) is the most efficient approach.